Your LLM calls don't live in isolation. Neither should your observability.
Start FreeSimple Setup
Deploy in minutes
Global Access
Use from anywhere
Expert Support
Chat, email, and consulting available
LLM observability tools like Arize Phoenix, LangSmith, Langfuse, and Helicone are excellent at what they do: tracing LLM calls, tracking token usage, measuring costs, and evaluating output quality. But your LLM calls do not live in isolation. They depend on API gateways, databases feeding context, vector stores serving embeddings, and the services running all of it. IAPM correlates LLM telemetry with application health in a single 3D spatial view. This page is an honest look at where IAPM adds value and where these tools excel.
IAPM is the product; spatial observability is the category. We are not an APM company, we are a spatial observability company. Where LLM-only tools flatten AI workloads into isolated traces, IAPM un-compresses your LLM calls back into the full, high-dimensional reality of the system they run on: the gateways, vector stores, embedding services, and databases they depend on, correlated with application health in one spatial view.
Most teams run two observability stacks for AI apps. One for LLM, one for everything else.
IAPM brings both into one spatial view.
The Blind Spot in LLM Observability
Your LLM calls depend on your application. Your LLM tools cannot see it.
- LLM-only tools see the LLM call, but not the API gateway, the vector store, the embedding service, or the database feeding context.
- When latency spikes, is it the model, the retrieval pipeline, or the database behind it? LLM-only tools cannot answer that question.
- Two observability stacks: most teams run a traditional APM tool for application health and an LLM tool for AI workloads. Two dashboards. No correlation between them.

One spatial view. LLM calls in the context of your entire system.

Spatial Observability + LLM in One View
See your LLM calls in the context of your entire application stack.
- 3D spatial topology: Your LLM services, the APIs that call them, the vector databases they query, and the relationships between all of them.
- When a RAG pipeline slows down, you see the entire chain: the API request, the vector store query, the LLM call, and the response, all in spatial context.
- Tessa understands both your LLM workloads and your application stack, tracing a slow completion back to a database connection pool exhaustion three services upstream, then fixing it.
LLM observability that sees the whole system
IAPM vs LLM Observability Tools
Application-level correlation is the gap.
Each LLM observability tool excels at the LLM layer. Arize Phoenix pairs a strong evaluation framework with 40+ auto-instrumentations via OpenInference (arize.com, github.com/Arize-ai). LangSmith is framework-agnostic, ingesting traces over OpenTelemetry as well as from LangChain, with prompt management built in (docs.langchain.com). Langfuse offers open-source (MIT core) prompt management and OTel ingestion (langfuse.com, github.com/langfuse). Helicone provides a simple gateway/proxy with cost tracking, rate limiting, and caching (helicone.ai, docs.helicone.ai). None of them provide spatial observability across your full application stack: service topology, application monitoring, or cross-signal correlation. IAPM fills that gap.
Note: the LLM-evaluation-quality ratings below (strong/good/basic) are IAPM's qualitative assessment, not vendor-sourced facts. These evaluation-framework ratings reflect IAPM's qualitative assessment based on each tool's published evaluation features (datasets, online evals, annotation, experiment tracking) as of 2026-06-01, not a quantitative benchmark. Capability cells reflect each vendor's first-party documentation verified 2026-06-01.
| Capability | IAPM | Arize Phoenix | LangSmith | Langfuse | Helicone |
|---|---|---|---|---|---|
| LLM Tracing | Yes | Yes | Yes | Yes | Yes |
| Application Monitoring (APM) | Included (via OTel) | No (LLM observability only) | No | No | No |
| Service Topology / Maps | 3D Spatial | No | No | No | No |
| Cross-Signal Correlation | LLM + App + Traces | LLM only | LLM + OTel ingest | LLM + app metrics, OTel ingest | LLM only (gateway) |
| First-Party AI with Codebase Access | Tessa (bundled, workspace-aware, human-on-the-loop) | MCP only (external) | MCP only (external) | MCP only (external) | MCP only (external, read-only) |
| LLM Evaluation Framework (IAPM's assessment) | Basic | Strong | Strong | Good | Basic |
| Prompt Management | Via codebase | Yes | Yes | Yes | Basic |
| OpenTelemetry Native | gen_ai.* (universal backend target: gen_ai.* + OpenInference + OpenLLMetry) | OTel-native (OpenInference, authored by Arize) | Framework-agnostic, OTel ingestion | Ingests gen_ai.* + OpenInference + OpenLLMetry | Gateway/proxy-based |
Note on "MCP only (external)": this means the tool exposes its data to an external AI client (Claude, Cursor) via an MCP server, rather than shipping a first-party AI that has direct, bundled access to your codebase the way Tessa does. Both approaches are valid; they differ in integration depth and accountability.
Tessa fixes code. You review it. You own it.
| Scenario | LLM-Only Tool | IAPM |
|---|---|---|
| RAG latency spike | Shows LLM call took longer | Shows vector DB connection pool exhausted, causing queuing upstream of LLM call |
| LLM cost spike | Shows token count increased | Correlates cost with traffic patterns, identifies which service generates excessive calls |
| Degraded output quality | Evaluation scores flag the issue | Traces to retrieval pipeline returning stale context due to upstream dependency |
| Code fix | No codebase access | Tessa navigates to source, makes the fix. You review, you own it. |
Why Application Context Matters for LLM Apps
The bottleneck is rarely the model.
A typical RAG application involves an API gateway, an embedding service, a vector database, a retrieval layer, an LLM API call, post-processing, and a response. When latency spikes, LLM-only tools show you the LLM call took longer. But was it actually the LLM?
In IAPM's 3D topology, you see the entire pipeline spatially. Tessa can identify that the vector database connection pool is exhausted, causing queuing upstream of the LLM call. The LLM itself is fine. The bottleneck is three services away.
One platform for LLM and application observability
Choosing the Right Tool
Honest guidance on when to use what.
- If you only need LLM evaluation and prompt testing: Arize Phoenix or LangSmith may be the right fit. They have deeper LLM-specific evaluation capabilities than IAPM today.
- If you need LLM observability AND application monitoring: IAPM replaces two tools with one. Your LLM traces, application traces, and metrics in a single spatial view.
- If you need to correlate LLM performance with system health: Only IAPM connects LLM call latency to upstream application bottlenecks in 3D topology.
- If you need AI that fixes code: Tessa works across both LLM and application code. LLM tools have no codebase access.
| Capability | IAPM (Analyze) | LLM Tool + APM Tool |
|---|---|---|
| LLM Observability | Included | LLM tool (separate bill) |
| Application Monitoring (APM) | Included | APM tool (separate bill) |
| Service Topology | Included (3D spatial) | APM tool only (if available) |
| AI Assistant | Included (Tessa) | Not available in LLM tools |
| Cross-Signal Correlation | LLM + App unified | No correlation between tools |
| Estimated Monthly (40 nodes) | $1,575 | Multiple bills, no unified view |
IAPM pricing from immersivefusion.com/pricing. $45/node/month (Analyze tier). All prices USD.
Your OTel instrumentation works with IAPM out of the box
Already Using an LLM Tool? Add Application Context.
Keep your LLM tool for evaluation. Add IAPM for everything else.
- Dual-destination: Your OTel Collector fans out telemetry to both IAPM and your LLM tool simultaneously.
- No code changes: If you already use OTel SDKs, your instrumentation does not change.
- Complement or replace: Use IAPM alongside your LLM tool, or consolidate when ready. Your choice.
- Exit guarantee: If IAPM is not right for you, change one endpoint URL. Your instrumentation stays exactly the same.
Dual-Destination Collector Config
exporters:
  otlp/iapm:
    endpoint: "https://otlp.iapm.app"
    headers:
      API-Key: "YOUR-API-KEY"
  otlp/llm-tool:
    endpoint: "your-llm-tool:4317"

service:
  pipelines:
    traces:
      exporters: [otlp/iapm, otlp/llm-tool]
    metrics:
      exporters: [otlp/iapm]
Standard OTel Collector config. LLM traces go to both. Application metrics go to IAPM.
Detailed tool-by-tool comparisons
Arize Phoenix
Strong LLM eval framework, 40+ OpenInference auto-instrumentations, Phoenix MCP server. LLM observability only: no service topology or application metrics. AX Pro from $50/mo.
CompareLangSmith
Framework-agnostic with OpenTelemetry ingestion (not LangChain-only), prompt management. No application-level correlation. Developer tier free, Plus $39/seat.
CompareLangfuse
Open-source (MIT core), OTel ingestion, LLM application-level metrics. No service/infra topology. Acquired by ClickHouse (2026-01-16), stays MIT-licensed and self-hostable. Hobby free, Core $29, Pro $199.
CompareHelicone
LLM gateway/proxy with cost tracking, rate limiting, and caching. No distributed tracing. Acquired by Mintlify (2026-03-03); standalone product now in maintenance mode, so weigh continuity before adopting. Free 10K requests, Pro $79.
CompareReady to See LLM Observability in Context?
Start free with IAPM. Your OpenTelemetry instrumentation just works.
Start FreeAlways-On Demo
Running right now, unscripted, and nobody started it for you. It is a synthetic system rather than a customer's, but nothing about it is staged: we point chaos at it and hunt the gap live. Watch for a minute, send it to whoever is on call with you, or scroll on and go play with one yourself.
That's our side of it. Now go try the alternative.
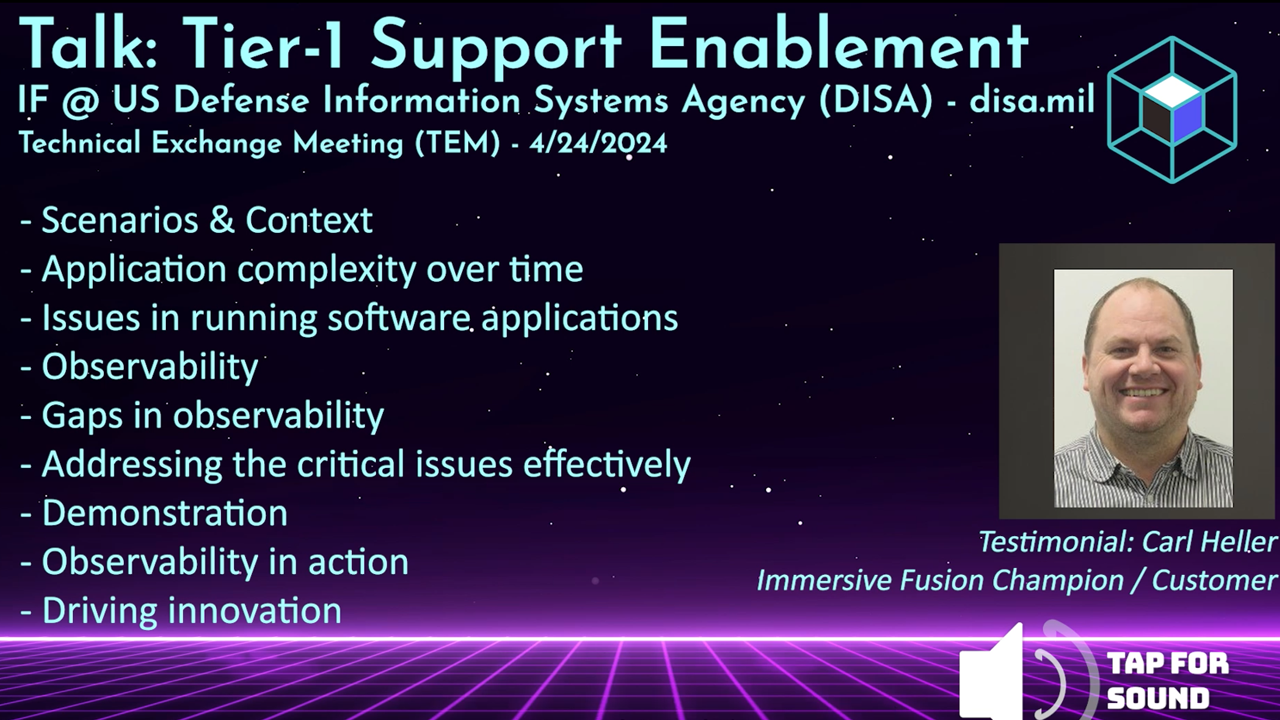
See what our customers are saying
Testimonial from the US Defense Information Systems Agency (DISA/disa.mil) talkWatch the testimonial from the DISA TEM talk | Request the full DISA TEM talk video
The Better Way to Monitor and Manage Your Software
Streamlined Setup
Simple integration
Cloud-native and open source friendly
Rapid Root Cause Analysis
Intuitive tooling
Find answers in a single glance. Know the health of your application
AI Powered
AI Assistant by your side
Unlock the power of AI for assistance and resolution
Intuitive Solutions
Conventional and Immersive
Expert tools for every user:
DevOps, SRE, Infra, Education