LLM gateway intelligence meets spatial observability.
Start FreeSimple Setup
Deploy in minutes
Global Access
Use from anywhere
Expert Support
Chat, email, and consulting available
Helicone provides simple, elegant LLM proxy integration. Route your API calls through their gateway and you get cost tracking, rate limiting, caching, and request logging with minimal setup. We respect that simplicity. This page is an honest look at where IAPM takes a different approach, where Helicone excels, and how you can evaluate both.
One thing to weigh first if you are evaluating Helicone in 2026: Helicone was acquired by Mintlify (announced 2026-03-03), and the standalone product is now in maintenance mode (security patches and new model support, no active feature development); Mintlify has said it will work with customers on migrating to another platform (source: helicone.ai/blog, mintlify.com/blog, verified 2026-06-21). Continuity is the first question to ask before adopting it.
IAPM is the product; spatial observability is the category. We are not an APM company, we are a spatial observability company.
Beyond the gateway. Full request lifecycle visibility.
Gateway Metrics Without Application Context
You see the LLM call. You do not see what triggered it.
- Gateway-level visibility is surface-level visibility. You see the LLM request and response. You do not see the application code that triggered the call, the service chain that led to it, or the vector database query that fed the context.
- When latency spikes, Helicone tells you the model was slow. It cannot tell you whether the slowdown started upstream in your application stack.
- No distributed (microservice/OTel) tracing: Helicone captures LLM request/response pairs and LLM-session/agent traces. It does not capture distributed traces across your microservices via OpenTelemetry. (source: github.com/Helicone/helicone, verified 2026-06-01)

Application-level depth. Full distributed traces. One view.

Go Deeper Than Gateway Metrics
See LLM calls in the context of the full request lifecycle.
- Full distributed traces across all services: from the user request, through your API gateway, into your application logic, through the retrieval pipeline, to the LLM call, and back.
- 3D spatial topology: See the entire journey rendered spatially. When your LLM feature degrades, understand whether the issue is the model, the gateway, the retrieval layer, or the application underneath.
- Application-level correlation: Helicone tells you the model call took 2.3 seconds. IAPM tells you that 1.8 seconds was the vector database query, and Tessa has a fix ready.
Application-level tracing. Dependency correlation. Full context.
Architecture: How We Differ
Application-level instrumentation vs gateway proxy.
Helicone has the simplest integration story in LLM observability: change your base URL and you are instrumented. The built-in rate limiting, response caching, and cost tracking at the gateway level are practical features that work immediately with no SDK changes.
IAPM goes deeper than the API boundary. Application-level OpenTelemetry instrumentation captures the full distributed trace: every service, every dependency, every application metric. Your LLM calls appear in the context of the complete request lifecycle.
| Aspect | IAPM | Helicone |
|---|---|---|
| Scope | LLM observability + distributed tracing (spatial observability) | LLM gateway proxy (API-level monitoring) |
| Integration Model | OpenTelemetry SDK instrumentation (application-level) | Simple proxy URL swap (gateway-level) |
| Trace Depth | Full distributed traces across all services | LLM request/response pairs and LLM-session traces; no distributed (microservice/OTel) tracing (source: github.com/Helicone/helicone, verified 2026-06-01) |
| Visualization | 3D spatial topology + web dashboards | Request logs, usage dashboards |
| Service Topology | Auto-discovered 3D service map | No service topology (source: github.com/Helicone/helicone, verified 2026-06-01) |
| Application Metrics | Application metrics via OTel correlated with traces | No application-level metrics (source: github.com/Helicone/helicone, verified 2026-06-01) |
| Cost Tracking | Token and cost telemetry via OTel | Built-in cost tracking and budget alerts (source: docs.helicone.ai/guides/cookbooks/cost-tracking, verified 2026-06-01) |
| Rate Limiting / Caching | Application-level (your infrastructure) | Built-in gateway rate limiting and response caching (source: docs.helicone.ai, verified 2026-06-01) |
| Cross-Signal Correlation | Traces + metrics + logs unified in spatial view | Gateway logs only |
Tessa fixes code. You review it. You own it.
| Capability | Tessa (IAPM) | Helicone |
|---|---|---|
| AI Diagnosis | Cross-signal anomaly detection with spatial context | Read-only MCP Server exposes observability data to Claude Desktop / Cursor; no remediation agent (source: docs.helicone.ai/integrations/tools/mcp, verified 2026-06-01) |
| Codebase Access | Full workspace: read, search, rename, modify | No first-party workspace access; Helicone MCP is read-only observability query (query_requests/query_sessions only) (source: docs.helicone.ai/integrations/tools/mcp, verified 2026-06-01) |
| Code Fixes | Tessa proposes the fix in your workspace, you review, you approve | No remediation or action agent (source: docs.helicone.ai/integrations/tools/mcp, verified 2026-06-01) |
| Root Cause Analysis | Application-level: LLM + app + dependencies | Gateway-level request logs only |
| Accountability Model | Human on the loop | Manual debugging by engineer |
AI: Tessa vs Manual Investigation
Human on the loop.
Tessa accesses your codebase workspace, diagnoses from 3D topology, and makes the fix. You review, you own it. When your LLM feature experiences increased error rates, Tessa does not just show you the failed API calls. It traces the issue through the full request lifecycle, correlates it with application health, identifies the root cause, and proposes a code fix.
Helicone shows you that your LLM API calls are failing. Tessa tells you why, traces the cause to your code, and writes the fix.
One platform for LLM + application monitoring. One price.
Pricing: Application Observability Value
One platform vs gateway tool + APM tool.
- One platform, not three: IAPM includes LLM observability, APM, and AI diagnosis. Helicone covers the LLM gateway layer only.
- Application-level depth: Gateway metrics tell you what happened at the API boundary. IAPM tells you what happened across your entire stack.
- Predictable pricing: Nodes x tier price = monthly cost. No per-request or per-log charges.
- AI included: Tessa is included in every tier, including the free Start tier. No separate AI add-on to budget for.
| Capability | IAPM | Helicone |
|---|---|---|
| LLM Observability | Included | Free (10K req/mo) / Pro $79/mo / Team $799/mo / Enterprise custom (source: helicone.ai/pricing, verified 2026-06-21; product in maintenance mode post-Mintlify acquisition) |
| Application Monitoring (APM) | Included | Not available (requires separate tool) |
| APM / Distributed Tracing | Included | Not available (requires separate tool) |
| AI Assistant | Included (Tessa) | Not available |
| 3D Spatial Topology | Included | Not available |
| Application Observability Total | $45/node/month (Analyze) | Helicone + APM tool = multiple bills |
IAPM pricing from immersivefusion.com/pricing. Helicone pricing from helicone.ai/pricing. Verify current pricing before purchase. All prices USD.
Keep gateway features. Add application-level depth.
Already Using Helicone? Add Application-Level Depth.
Complement gateway metrics with application-level tracing.
- Keep gateway features: If you rely on Helicone's rate limiting and caching, keep the proxy. IAPM adds the application observability layer.
- Add OTel instrumentation: Add OpenTelemetry to your services and point the Collector at IAPM. Your LLM calls appear in the context of the full request lifecycle.
- Zero re-instrumentation: Your OpenTelemetry SDKs work with IAPM out of the box.
- Exit guarantee: If IAPM is not right for you, change one endpoint URL. Your instrumentation stays exactly the same.
OTel Collector Config
exporters:
  otlp/iapm:
    endpoint: "https://otlp.iapm.app"
    headers:
      API-Key: "YOUR-API-KEY"

service:
  pipelines:
    traces:
      exporters: [otlp/iapm]
    metrics:
      exporters: [otlp/iapm]
Standard OTel Collector config. Application telemetry flows to IAPM. Keep Helicone as your LLM proxy alongside if needed.
Ready to Go Deeper Than Gateway Metrics?
Start free with IAPM. Your OTel instrumentation just works.
Start FreeCompare IAPM against other tools | LLM observability comparison | Enter a live system
Always-On Demo
Running right now, unscripted, and nobody started it for you. It is a synthetic system rather than a customer's, but nothing about it is staged: we point chaos at it and hunt the gap live. Watch for a minute, send it to whoever is on call with you, or scroll on and go play with one yourself.
That's our side of it. Now go try the alternative.
See what our customers are saying
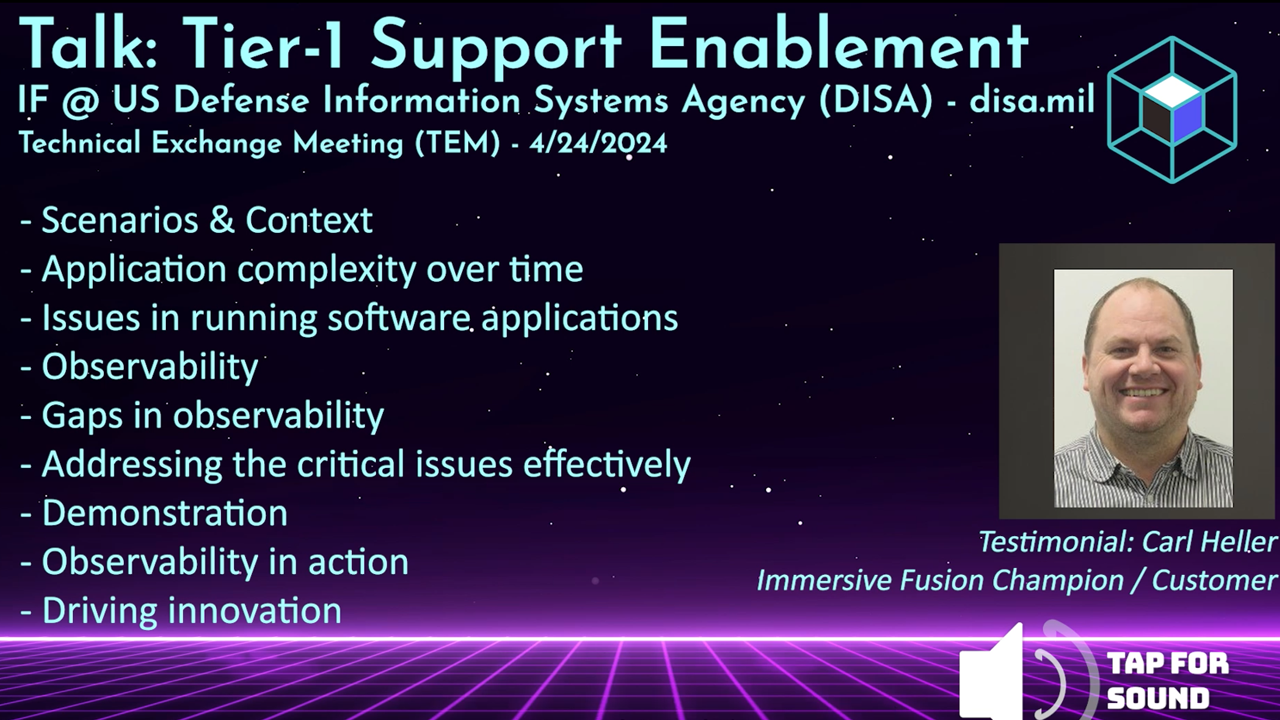
Testimonial from the US Defense Information Systems Agency (DISA/disa.mil) talkWatch the testimonial from the DISA TEM talk | Request the full DISA TEM talk video
The Better Way to Monitor and Manage Your Software
Streamlined Setup
Simple integration
Cloud-native and open source friendly
Rapid Root Cause Analysis
Intuitive tooling
Find answers in a single glance. Know the health of your application
AI Powered
AI Assistant by your side
Unlock the power of AI for assistance and resolution
Intuitive Solutions
Conventional and Immersive
Expert tools for every user:
DevOps, SRE, Infra, Education