All the openness. None of the assembly.
Start FreeSimple Setup
Deploy in minutes
Global Access
Use from anywhere
Expert Support
Chat, email, and consulting available
Grafana Labs was named a Leader in the 2025 Gartner Magic Quadrant for Observability Platforms, positioned furthest for Completeness of Vision (source, verified 2026-06-01), with 74,000+ GitHub stars (source, verified 2026-06-01) and the most respected open-source observability ecosystem in the industry. We respect that. This page is an honest look at where IAPM takes a different approach, where Grafana excels, and how you can evaluate both with the same production data.
IAPM is the product; spatial observability is the category. We are not an APM company, we are a spatial observability company.
Six tools. Six configurations. One observability goal.
Source: grafana.com LGTM stack (Loki, Grafana, Tempo, Mimir)
The Assembly Required Problem
Six tools. Six configurations. One observability goal.
- Loki, Tempo, Mimir, Pyroscope, Alloy, Grafana: each tool is best-in-class, but assembling them into a unified observability platform is your job.
- Assembly tax: configuration, upgrades, scaling, cross-signal correlation, and on-call for the monitoring system itself.
- Platform engineering bandwidth: for teams that need to ship features, not manage observability infrastructure, the assembly tax is real.
All the openness. Zero assembly required.
What If It Came Assembled?
One platform. Fully managed. Still OTel-native.
- Same commitment to open standards: no proprietary agents, no vendor lock-in. Your OTel instrumentation works with any compatible backend.
- Single, managed platform: traces, metrics, logs, AI, and 3D topology in one product, not six tools you wire together.
- Capabilities dashboards cannot deliver: spatial topology and an AI assistant that fixes code.
One platform. Not six tools wired together.
Architecture: How We Differ
Unified platform vs composable stack.
IAPM and Grafana share the same commitment to open standards and OpenTelemetry. The difference is what happens after data ingestion. Grafana gives you the best dashboards in the industry. IAPM gives you a 3D spatial environment where your services, relationships, and telemetry live together, plus an AI assistant that can diagnose issues and fix your code.
Grafana Cloud reduces the operational burden compared to self-hosted, but the architecture is still multiple tools with separate backends. IAPM is a single, unified platform from the start.
| Aspect | IAPM | Grafana |
|---|---|---|
| Platform Model | Unified managed platform | LGTM stack (Loki + Grafana + Tempo + Mimir + Pyroscope + Alloy) |
| Instrumentation | Standard OpenTelemetry SDKs only | OpenTelemetry-native (Alloy + Beyla) |
| Visualization | 3D spatial topology | 2D dashboards (industry-leading flexibility) |
| Vendor Lock-in | None. Change one endpoint URL to leave. | None. Open-source components, standard APIs. |
| Operational Burden | Fully managed SaaS | Self-managed (OSS) or Grafana Cloud (managed) |
| Community | Growing | 74,000+ GitHub stars, massive ecosystem (source, verified 2026-06-01) |
Tessa fixes code. You review it. You own it.
| Capability | Tessa (IAPM) | Grafana Assistant |
|---|---|---|
| Codebase Access | Full workspace: read, search, rename, modify | Via Grafana Cloud CLI (gcx, public preview) auto-detecting Claude Code / Cursor, plus the gcx CLI / Grafana MCP server (source, verified 2026-06-01) |
| Production Context | 3D topology + traces + metrics | Dashboard metrics, query generation, incident analysis (LGTM stack) |
| Code Fixes | Tessa proposes the fix in your workspace, you review, you approve | No native code-fix feature. Grafana Assistant Skills (GA at GrafanaCON 2026) plus auto-approve let users build runbooks that connect to external tools; Grafana's own example is "raising a PR in GitHub or GitLab" via a user-configured pipeline, not an out-of-the-box code-writing agent (source, verified 2026-06-01) |
| Pricing | Included in every tier, including the free Start tier | $20/active user/month Assistant seat (Grafana Cloud Pro); Enterprise plan is custom, starts ~$25,000/yr (source, verified 2026-06-01) |
| Spatial Context | 3D topology-aware diagnosis | Dashboard-only context |
| Accountability | Human on the loop | Query suggestions and incident summaries |
AI: Tessa vs Grafana Assistant
Human on the loop.
Tessa connects your production telemetry to your codebase. Add your repositories as workspaces, and Tessa traces a production issue from your 3D topology straight to the source file, then makes the fix.
Your code stays in your workspace. You review the changes. You commit when ready. Tessa does the work; you own the outcome.
Grafana Assistant helps you write queries, understand anomalies, and investigate incidents within the Grafana dashboard. Valuable for teams who live in Grafana, but it is query-focused with no codebase access. When the investigation is done, you still context-switch to your IDE to make the fix. And it costs $20/active user/month on top of your existing Grafana costs. Tessa is included in every tier, including the free Start tier, and goes from diagnosis to code fix in one conversation.
One price. Everything included.
Pricing: The Full Picture
Scenario: 40 nodes, 10 engineers.
Grafana Cloud's pricing appears transparent, but the multi-dimensional billing model (per-signal, per-user, per-feature) adds up. Here is what a production deployment looks like.
- What the premium buys: In this scenario IAPM ($1,575) runs about 24% above Grafana Cloud Pro ($1,267), and that gap buys a different class of product: 3D spatial topology, AI code fixes, and a unified platform in one per-node price, versus dashboards plus separately-billed tools. We show the full math below so you can judge the trade for yourself.
- No per-user fees: IAPM's platform and its built-in AI assistant are priced per node, not per user. Grafana charges $8/user for visualization and $20/user for AI separately.
- Predictable billing: IAPM's per-node pricing means your bill does not fluctuate with data volume. Grafana Cloud bills per GB across logs, traces, and profiles.
- No operational burden: Self-hosted Grafana is free to download, not free to operate. IAPM is fully managed with the same OTel portability.
| Line Item | IAPM | Grafana Cloud Pro |
|---|---|---|
| Platform Fee | Included | $19/month (source, verified 2026-06-01) |
| Application Observability (40 hosts) | Included | $18/host/mo x 40 = $720 (source, verified 2026-06-01) |
| Logs (500 GB/mo) | Included | $0.55/GB x 450 GB (after free 50 GB) = $248 (source, verified 2026-06-01) |
| Visualization (10 users) | Per node, not per user | $8/active user/mo x 10 = $80 (source, verified 2026-06-01) |
| AI Assistant (10 users) | Included (Tessa) | $20/active user/mo x 10 = $200 (source, verified 2026-06-01) |
| Estimated Monthly Total | $1,575 (Analyze) | $1,267+ (varies with data volume) |
Grafana Cloud pricing based on Pro tier rates from grafana.com/pricing, verified as of 2026-06-01. Actual costs vary by data volume and active users. Self-hosted Grafana is free but excludes operational costs. IAPM pricing from immersivefusion.com/pricing. All prices USD. Logs billed as a 3-part composite: $0.05/GB process + $0.40/GB write + $0.10/GB retain = $0.55/GB total.
You don't have to rip and replace
Run Both. Migrate Gradually.
Same telemetry, two destinations, zero re-instrumentation.
- Dual-destination: Your OTel Collector fans out telemetry to both IAPM and Grafana simultaneously.
- Both platforms are OTel-native: migration is straightforward. Add an exporter, see your data in IAPM's 3D topology, and decide which experience your team prefers.
- Keep your Grafana dashboards: IAPM adds spatial topology and AI on top. You do not have to abandon existing dashboards.
- Exit guarantee: If IAPM is not right for you, change one endpoint URL. Your instrumentation stays exactly the same.
Dual-Destination Collector Config
exporters:
  otlp/iapm:
    endpoint: "https://otlp.iapm.app"
    headers:
      API-Key: "YOUR-API-KEY"
  otlp/grafana:
    endpoint: "otlp-gateway-prod-us-central-0.grafana.net:443"
    headers:
      Authorization: "Basic ${GRAFANA_CLOUD_TOKEN}"

service:
  pipelines:
    traces:
      exporters: [otlp/iapm, otlp/grafana]
    metrics:
      exporters: [otlp/iapm, otlp/grafana]
Standard OTel Collector config. Same telemetry, two destinations.
Always-On Demo
Running right now, unscripted, and nobody started it for you. It is a synthetic system rather than a customer's, but nothing about it is staged: we point chaos at it and hunt the gap live. Watch for a minute, send it to whoever is on call with you, or scroll on and go play with one yourself.
That's our side of it. Now go try the alternative.
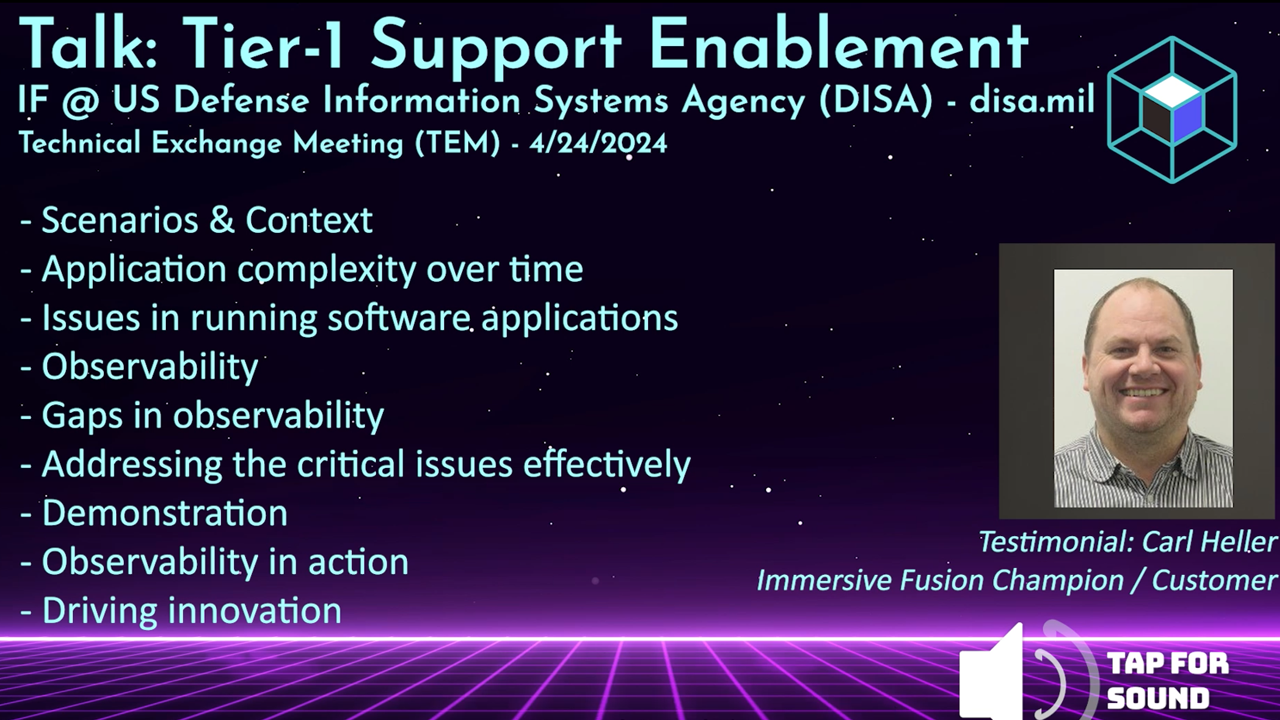
See what our customers are saying
Testimonial from the US Defense Information Systems Agency (DISA/disa.mil) talkWatch the testimonial from the DISA TEM talk | Request the full DISA TEM talk video
The Better Way to Monitor and Manage Your Software
Streamlined Setup
Simple integration
Cloud-native and open source friendly
Rapid Root Cause Analysis
Intuitive tooling
Find answers in a single glance. Know the health of your application
AI Powered
AI Assistant by your side
Unlock the power of AI for assistance and resolution
Intuitive Solutions
Conventional and Immersive
Expert tools for every user:
DevOps, SRE, Infra, Education