
Immersive Blogs
Publications about innovation and new functionality.
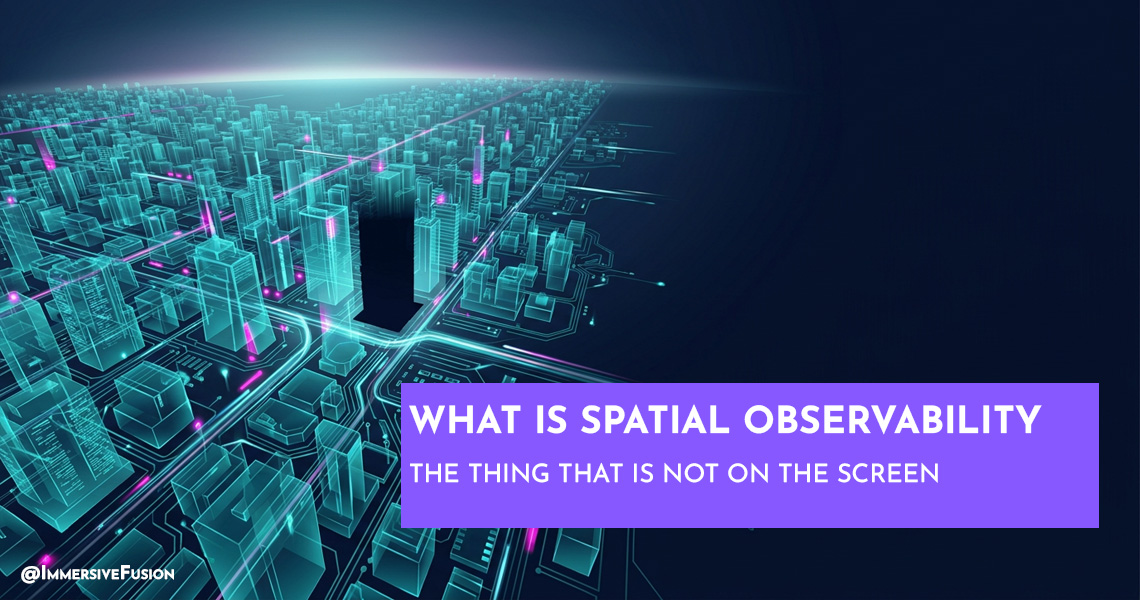
What Is Spatial Observability?
TL;DR. Your system has a shape. Services call each other, requests travel routes, and failures cluster in neighborhoods. Dashboards flatten that shape into panels. Spatial observability puts it back, so you can see the gap where something should be and is not.
Your dashboard is green. Every service reports healthy, because every service is, in fact, healthy. And yet somewhere between two of them, a request left one and never arrived at the other. The thing that is wrong is the thing that is not on the screen.
This is the gap a flat tool cannot close. It can fire an alert that a request failed to arrive. It cannot draw the gap where the request should have been, in the place where it should have been, next to the services it should have connected. That gap has a name, and the discipline of putting it back on the screen has a name. We call it spatial observability.
The definition
Spatial observability is the un-compression of high-dimensional system reality (service topology, request paths, failure neighborhoods, latency distance) back into the dimensions it always had, rather than flattening it onto dashboard panels. In plainer terms: your system has a shape, and dashboards flattened it.
Your system has a shape: services that call each other, requests that travel routes, failures that cluster in neighborhoods, latency that behaves like distance. Dashboards compressed that reality onto a grid of panels because in 2005 that was the best delivery surface available. Spatial observability un-compresses it: it renders the system back in the dimensions it always had, so you navigate the shape instead of reading its shadow.
DeepCube is the product. Spatial observability is the category. We are not building a better application performance monitoring tool. We are building the first product in a different category, and the difference is not cosmetic. It is a different posture toward what an engineer is allowed to see.
The thing flat tools cannot draw
A flat tool draws what it observes, and a disciplined dashboard can detect absence: the missing-heartbeat alert, the no-data panel, the anomaly on expected throughput. A trace waterfall can show a span that should have closed and did not. So detection is not the limitation. The limitation is that detection ends at a notification, or at a single trace among thousands, away from the place in the system where the missing thing belonged.
Most of the incidents that take longest to diagnose are absence incidents. The call that never returned. The queue that drained and never refilled. The heartbeat that was missed too quietly. A flat tool shows you the consequence: the latency spike, the error rate, the retry storm. It cannot situate the cause, the thing that should have happened and did not, in the topology where you would go to look for it.
A spatial system can render absence because it carries an expectation model. It knows what should have happened, and it builds that from what the system already emits. The service graph as it actually ran yesterday and the hour before. The traffic that crossed each edge. The spans that closed where they were supposed to close. The expectation is the live shape of the recent past, held against the live shape of right now. Where the two diverge is where the rendering goes. Then come the phantoms. The service that should be in the skyline and is not. The connection that should be carrying traffic and is not. The request that should have arrived and did not. That is the thing flat tools cannot draw, and the thing spatial observability exists to draw.
Topology becomes geography
Once the absence is on the screen alongside the presence, the rest of what your application has always been follows. Topology becomes geography. Request paths become routes. Failure neighborhoods become rooms.
You navigate by walking. You investigate by approaching. Your position in the world is your query, and the neighborhood around you is the filter. Walking to the payment service is how you ask about the payment service. A flat dashboard asks you to scan thousands of rows and decide what to ignore. A spatial system lets you walk to what you care about and lets the rest be quiet. A glow on the horizon, or a phantom in a neighborhood you can see, still tells you when something elsewhere has started to involve where you are.
This is built on OpenTelemetry, exclusively, with no proprietary agents. The shape is drawn from the standard telemetry your system already emits. Adopting spatial observability does not mean re-instrumenting your stack, and it does not mean giving up ownership of your data.
Not the metaverse
When people first hear "navigate your system in 3D," some pattern-match it to the consumer metaverse. It is a fair question and a quick one to answer. No NFTs, no virtual land, no speculation. It runs on your desktop and in your browser. A purpose, not a place.
The consumer metaverse failed on three structural counts, and spatial observability inverts each. It is a place because the work was already spatial, not a place hunting for a purpose. It ships on the desktop and the web first, with immersion offered where it helps and never imposed. And the world is populated by your live services, never an empty room. The useful archetype is not Meta or Horizon Worlds. It is the Bloomberg Terminal of production systems: a dense, purpose-built environment that professionals live inside because it shows them their domain better than anything flat ever could.
Why the category, and why now
The dashboard era earned its place. A flat grid of charts was the best a 2005 stack could do with a complex reality. Observability as a discipline is one of the real achievements of the post-monolith era. We do not dismiss it. We owe it. But the constraints that produced it, weak hardware, weak browsers, scarce bandwidth, have been gone for years. The hardware that renders modern games sits on most engineers' desks. The medium can finally match the dimensionality of the problem, and the problem was always spatial.
Spatial observability is the name for taking that seriously. The medium can finally match the dimensionality of the problem.
Want the precise reference definition and where it sits alongside APM and observability? See the Spatial Observability concept page in our documentation. Want the longer argument for why flatness was never good enough? Read the manifesto at spatialobservability.org. Want to stand inside it? Enter the World of Your Application®.

Dan Kowalski
DeepCube lead. Writes the open-source tools underneath it, Snowglobe and Shoebox, both Apache-2.0 and OpenTelemetry-native.
About Immersive Fusion
Immersive Fusion (immersivefusion.com) is pioneering the next generation of observability by merging spatial computing and AI to make complex systems intuitive, interactive, and intelligent. As the creators of DeepCube, we deliver solutions that combine web, 3D, and AI technologies, empowering teams to visualize and troubleshoot their applications in entirely new ways. This approach enables rapid root-cause analysis, reduces downtime, and drives higher productivity, transforming observability from static dashboards into an immersive, intelligent experience. Learn more about or join Immersive Fusion on LinkedIn, Mastodon, Bluesky, X, YouTube, Facebook, Instagram, GitHub, Twitch, Discord.Press inquiries: press@immersivefusion.com.
The Better Way to Monitor and Manage Your Software
Streamlined Setup
Simple integration
Cloud-native and open source friendly
Rapid Root Cause Analysis
Intuitive tooling
Find answers in a single glance. Know the health of your application
AI Powered
AI Assistant by your side
Unlock the power of AI for assistance and resolution
Intuitive Solutions
Conventional and Immersive
Expert tools for every user:
DevOps, SRE, Infra, Education