Experience real-time diagnostics in 3D
Start FreeSimple Setup
Deploy in minutes
Global Access
Use from anywhere
Expert Support
Chat, email, and consulting available
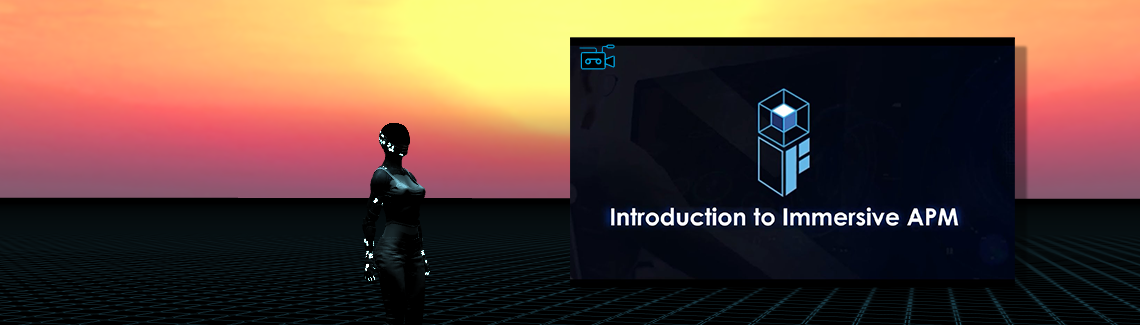
See the immersive experience
Watch the full experience video | Watch more videos on our YouTube channel
Watch how IAPM lets you enter your software environment, explore live data, and resolve issues with AI Assistant by your side.
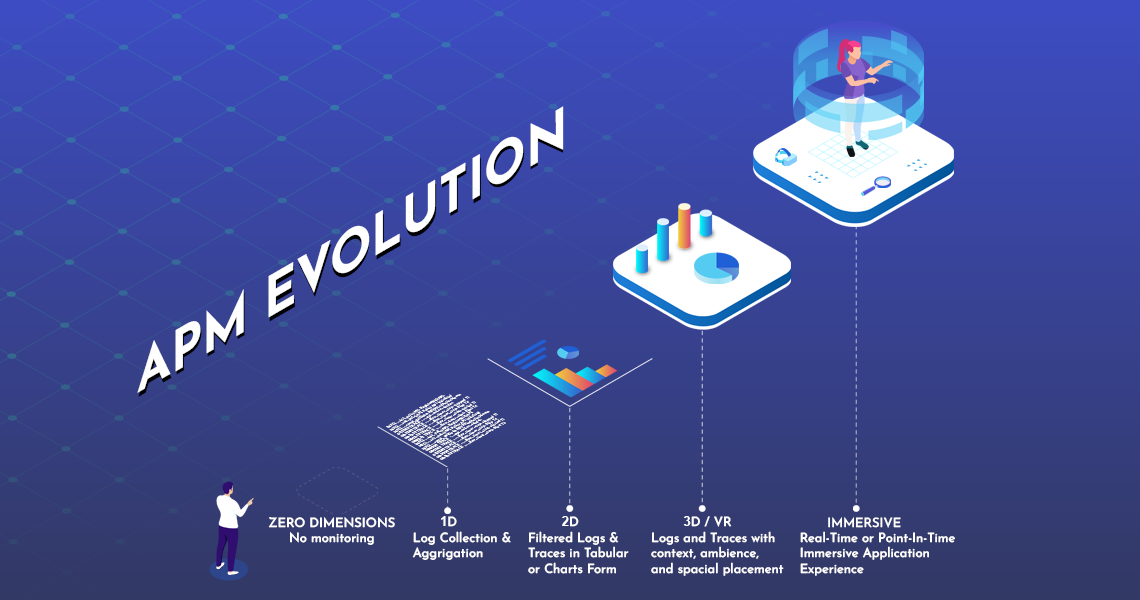
Traditional APM vs IAPM
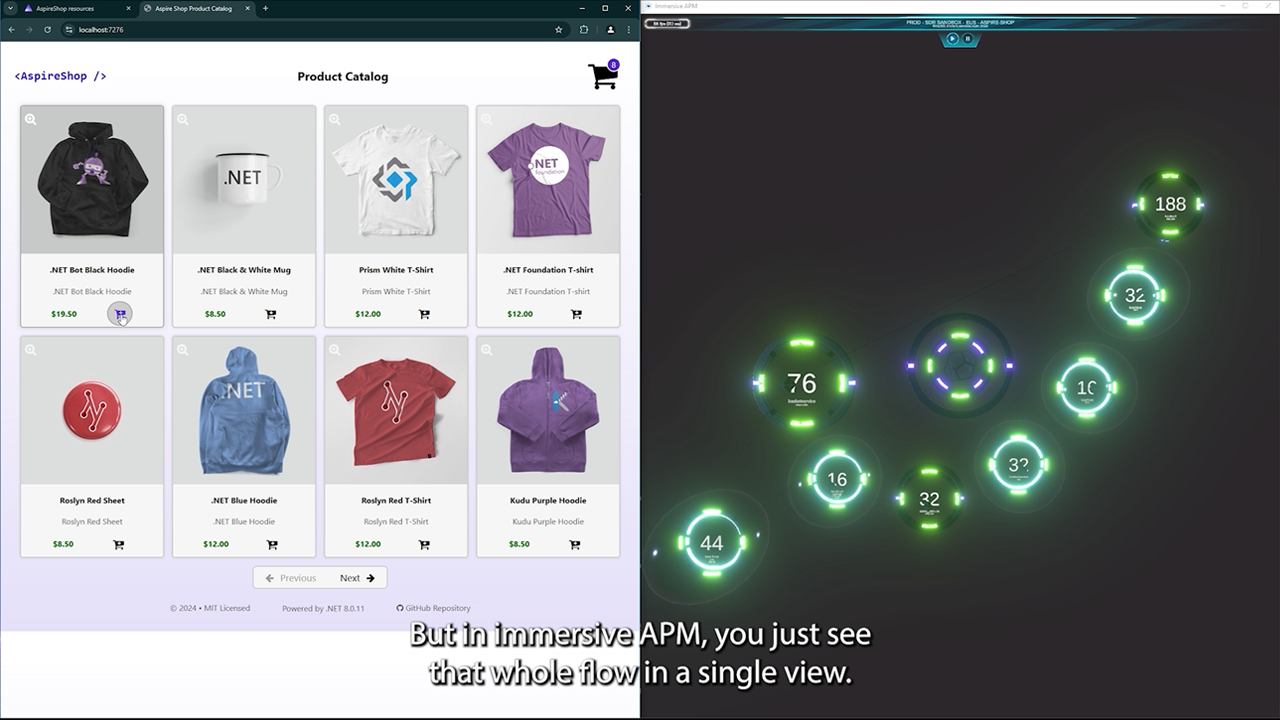
It's more than monitoring. It's being inside your application.
Immersive Fusion services enable you to Enter the World of your Application ® because we organically use all four dimensions to create an experience that you are used to in the real world: Be able to interact with and see any aspect of your application at any granularity with limited effort and immediate results.
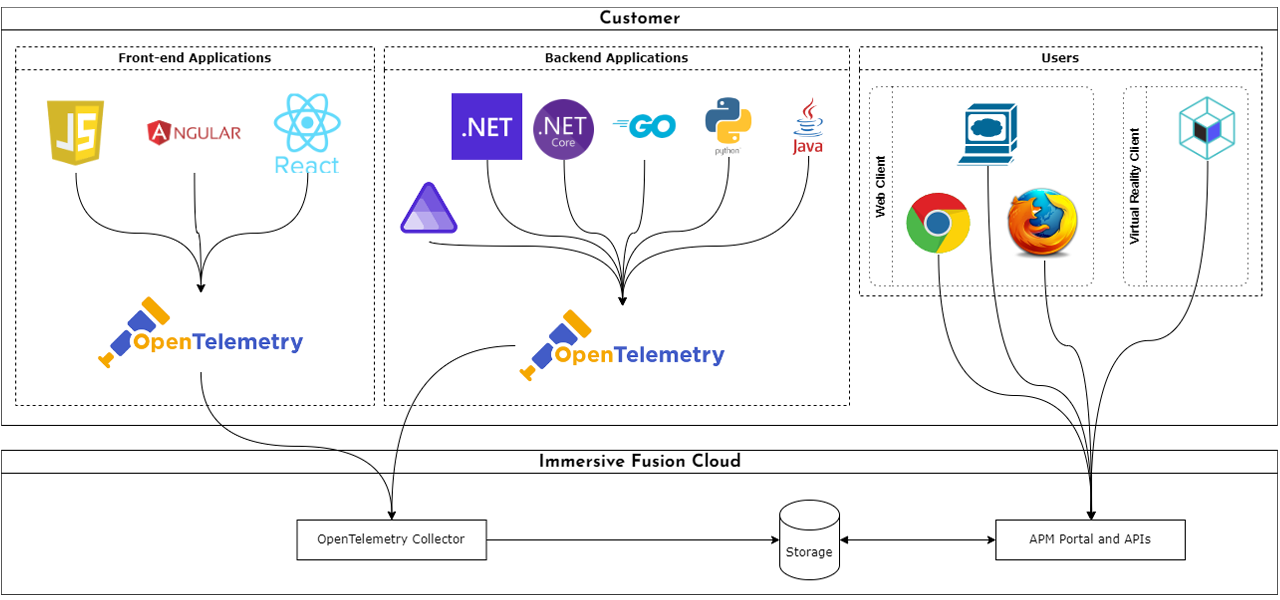
Application Data Flow
A complete turn-key solution that allows developers to quickly and easily integrate observability and analytics into their applications using only an API key and standard open-source packages. With this solution, developers can access a range of pre-built tools and services, without having to worry about the underlying infrastructure.
Traditional vs Immersive Experience Comparison
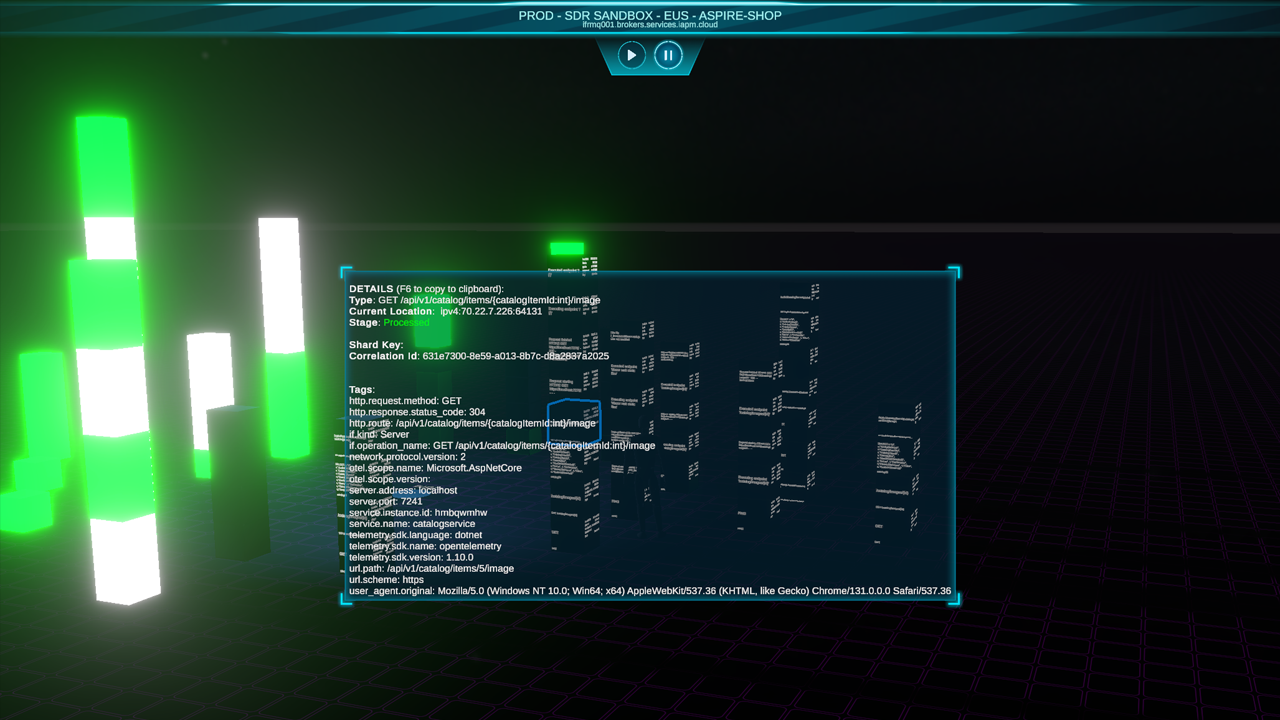
Application Operations Visibility and Diagnostic Output
Traces and Logs (Term Explanations)Traces are a type of telemetry data that provides a detailed view of the behavior of requests as they flow through a distributed system. They allow you to see the timing and dependencies of requests across multiple services and components. With OpenTelemetry, you can instrument your code to generate trace data and use it to analyze the performance and behavior of your application.
Logs, on the other hand, provide a detailed view of what is happening in an application. They are used to record events and messages that occur during the execution of an application. OpenTelemetry supports structured logging, which allows you to create logs with a predefined structure that can be easily queried and analyzed.
Traces and logs are correlated which means that you can use trace data to enrich your logs with additional context, such as the timing and dependencies of requests. This can be incredibly useful when troubleshooting issues in a distributed system.
Using 3D/VR visualization for telemetry information is incredibly efficient and effective. With traditional methods of analyzing telemetry data, users often find themselves sifting through endless grids, filtering through pages of data, and trying to decipher complex charts. This can be a time-consuming process, and it can be difficult to extract meaningful insights from the data.
End-to-End Application Operations
Spans and Distributed traces (Term Explanations)Spans are a type of telemetry data that provides a detailed view of the behavior of requests as they flow through a distributed system. They allow you to see the timing and dependencies of requests across multiple services and components. You can instrument your code to generate span data and use it to analyze the performance and behavior of your application.
Distributed traces are a collection of spans that represent the journey of a request through a distributed system. When a request is made, it can be traced across multiple services and components, and each span in the trace represents a specific operation or event in the journey of the request. Collect and analyze distributed traces, giving you a comprehensive view of the behavior of your application.
With the use of 3D/VR visualization, users can see all telemetry information about an application in real-time without the need for endless grids, filtering, or digging through pages of data. The benefits of using 3D visualization are clear: it allows users to quickly and easily identify patterns and trends in the data, without the need for extensive analysis.
Ready to Enter the World of Your Application®?
Unlock immersive diagnostics, AI-guided resolution, and full-stack clarity - all in one powerful platform.
See what our customers are saying
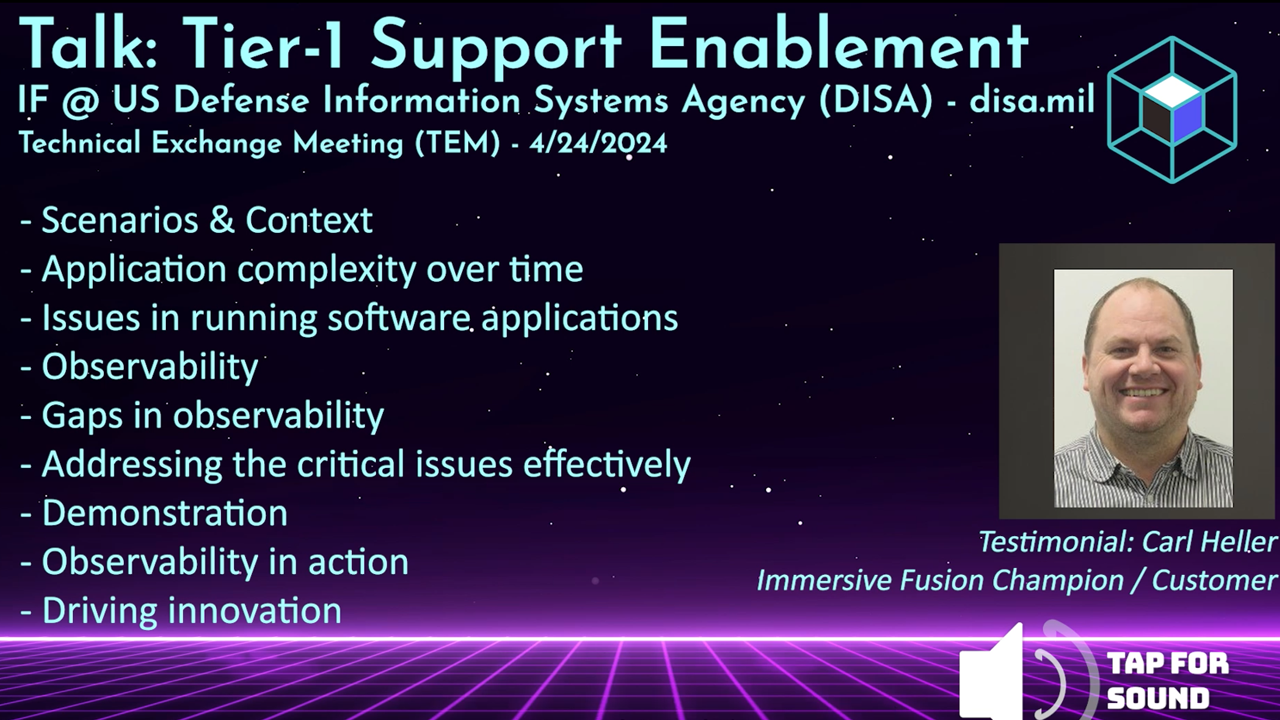
Testimonial from the US Defense Information Systems Agency (DISA/disa.mil) talkWatch the testimonial from the DISA TEM talk | Request the full DISA TEM talk video
See an awesome showcase
Watch the showcase video | Watch the full video | Watch more videos on our YouTube channel
The Better Way to Monitor and Manage Your Software
Streamlined Setup
Simple integration
Cloud-native and open source friendly
Rapid Root Cause Analysis
Intuitive tooling
Find answers in a single glance. Know the health of your application
AI Powered
AI Assistant by your side
Unlock the power of AI for assistance and resolution
Intuitive Solutions
Conventional and Immersive
Expert tools for every user:
DevOps, SRE, Infra, Education